I want to create multiple charts on excel spreadsheet by powershell.
But I’m struggling to create ranges that are separate each other.
In case the series and data are locate side by side, it is able to make ranges as follows.
$dataRange = $ws.range(“E1:S14”)
However, when Legend and Data table are separate, I’m unable to set regions.
I’ve tried this format, but it returns an error.
$range = $ws.range(“E1:E14”,“H1:S14”)
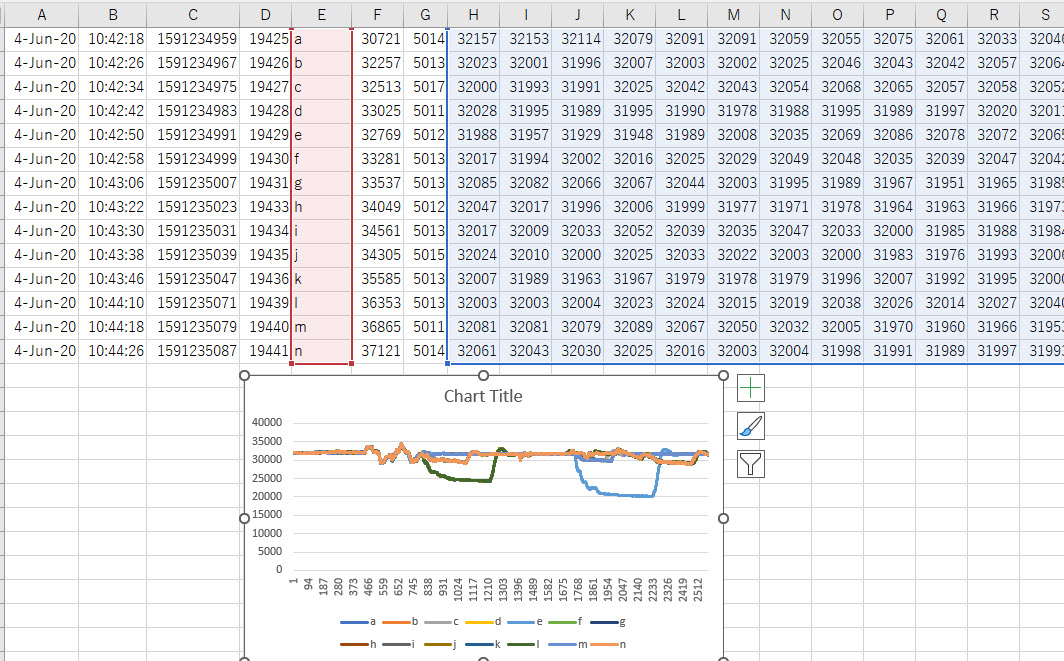
Attached image is created by manual operation with use of Ctrl key.
I’d like to create this separate region with Powershell.
Please advise.